

Step by step instructions: How to deploy OpenSearch Operator inside Kubernetes Cluster (EKS)
Prerequirements
Install Helm
brew install helmbrew install helmfile brew install kubectl
Add Plugin Helm
helm plugin install https://github.com/databus23/helm-diffhelm plugin install https://github.com/hypnoglow/helm-s3.git
Add Helm Repository S3 Bucket
### LAB ###
helm s3 init s3://devopscorner-helm-chart/lab
AWS_REGION=ap-southeast-1 helm repo add devopscorner-lab s3://devopscorner-helm-chart/lab

### STAGING ###
helm s3 init s3://devopscorner-helm-chart/staging
AWS_REGION=ap-southeast-1 helm repo add devopscorner-staging s3://devopscorner-helm-chart/staging

### PRODUCTION ###
helm s3 init s3://devopscorner-helm-chart/prod
AWS_REGION=ap-southeast-1 helm repo add devopscorner s3://devopscorner-helm-chart/prod
helm repo update
Update Repository
helm repo add stable https://charts.helm.sh/stablehelm repo add opensearch-operator https://opster.github.io/opensearch-k8s-operator/
helm repo update
helm repo list
NAME URLopensearch-operator https://opster.github.io/opensearch-k8s-operator/
stable https://charts.helm.sh/stable
Create Namespace
kubectl create namespace observability
Install OpenSearch Operator
helm install opsearch opensearch-operator/opensearch-operator --create-namespace -n observability
NAME: opsearch
LAST DEPLOYED: Sat Nov  4 09:08:25 2023
NAMESPACE: observability
STATUS: deployed
REVISION: 1
TEST SUITE: None
Install Cluster OpenSearch
Change this default OpenSearch-Cluster.yaml
apiVersion: opensearch.opster.io/v1
kind: OpenSearchCluster
metadata:
  name: my-cluster
  namespace: default
spec:
  general:
    version: "1.3.0"
    httpPort: 9200
    vendor: opensearch
    serviceName: my-cluster
    monitoring:
      enable: true
    pluginsList: ["repository-s3"]
  dashboards:
    version: "1.3.0"
    enable: true
    replicas: 2
    resources:
      requests:
        memory: "1Gi"
        cpu: "500m"
      limits:
        memory: "1Gi"
        cpu: "500m"
  confMgmt:
    smartScaler: true
  nodePools:
    - component: masters
      replicas: 3
      diskSize: "30Gi"
      nodeSelector:
      resources:
        requests:
          memory: "2Gi"
          cpu: "500m"
        limits:
          memory: "2Gi"
          cpu: "500m"
      roles:
        - "master"
        - "data"
    - component: nodes
      replicas: 3
      diskSize: "30Gi"
      nodeSelector:
      resources:
        requests:
          memory: "2Gi"
          cpu: "500m"
        limits:
          memory: "2Gi"
          cpu: "500m"
      roles:
        - "data"
    - component: coordinators
      replicas: 3
      diskSize: "30Gi"
      nodeSelector:
      resources:
        requests:
          memory: "2Gi"
          cpu: "500m"
        limits:
          memory: "2Gi"
          cpu: "500m"
      roles:
        - "ingest"
LAB Configuration (Simple Cluster)
apiVersion: opensearch.opster.io/v1
kind: OpenSearchCluster
metadata:
  name: opsearch
  namespace: observability
spec:
  general:
    version: "1.3.0"
    httpPort: 9200
    vendor: opensearch
    serviceName: opsearch
    monitoring:
      enable: true
    pluginsList: ["repository-s3"]
  dashboards:
    version: "1.3.0"
    enable: true
    replicas: 1
    nodeSelector:
      node: devopscorner-monitoring
    resources:
      requests:
        memory: "200Mi"
        cpu: "500m"
      limits:
        memory: "512Mi"
        cpu: "500m"
  confMgmt:
    smartScaler: true
  nodePools:
    - component: masters
      replicas: 2
      diskSize: "10Gi"
      nodeSelector:
        node: devopscorner-monitoring
      resources:
        requests:
          memory: "2Gi"
          cpu: "500m"
        limits:
          memory: "2Gi"
          cpu: "500m"
      roles:
        - "master"
        - "data"
LAB Configuration (HA Cluster)
apiVersion: opensearch.opster.io/v1
kind: OpenSearchCluster
metadata:
  name: opsearch
  namespace: observability
spec:
  general:
    version: "1.3.0"
    httpPort: 9200
    vendor: opensearch
    serviceName: opsearch
    monitoring:
      enable: true
    pluginsList: ["repository-s3"]
  dashboards:
    version: "1.3.0"
    enable: true
    replicas: 1
    nodeSelector:
      node: devopscorner-monitoring
    resources:
      requests:
        memory: "200Mi"
        cpu: "500m"
      limits:
        memory: "512Mi"
        cpu: "500m"
  confMgmt:
    smartScaler: true
  nodePools:
    - component: masters
      replicas: 2
      diskSize: "30Gi"
      nodeSelector:
        node: devopscorner-monitoring
      resources:
        requests:
          memory: "2Gi"
          cpu: "500m"
        limits:
          memory: "2Gi"
          cpu: "500m"
      roles:
        - "master"
        - "data"
    - component: nodes
      replicas: 2
      diskSize: "30Gi"
      nodeSelector:
        node: devopscorner-monitoring
      resources:
        requests:
          memory: "2Gi"
          cpu: "500m"
        limits:
          memory: "2Gi"
          cpu: "500m"
      roles:
        - "data"
    - component: coordinators
      replicas: 2
      diskSize: "30Gi"
      nodeSelector:
        node: devopscorner-monitoring
      resources:
        requests:
          memory: "2Gi"
          cpu: "500m"
        limits:
          memory: "2Gi"
          cpu: "500m"
      roles:
        - "ingest"
Production Configuration (HA Cluster)
apiVersion: opensearch.opster.io/v1
kind: OpenSearchCluster
metadata:
  name: opsearch
  namespace: observability
spec:
  general:
    version: "1.3.0"
    httpPort: 9200
    vendor: opensearch
    serviceName: opsearch
    monitoring:
      enable: true
    pluginsList: ["repository-s3"]
  dashboards:
    version: "1.3.0"
    enable: true
    replicas: 2
    nodeSelector:
      node: devopscorner-monitoring
    resources:
      requests:
        memory: "200Mi"
        cpu: "500m"
      limits:
        memory: "1Gi"
        cpu: "500m"
  confMgmt:
    smartScaler: true
  nodePools:
    - component: masters
      replicas: 3
      diskSize: "30Gi"
      nodeSelector:
        node: devopscorner-monitoring
      resources:
        requests:
          memory: "2Gi"
          cpu: "500m"
        limits:
          memory: "2Gi"
          cpu: "500m"
      roles:
        - "master"
        - "data"
    - component: nodes
      replicas: 3
      diskSize: "30Gi"
      nodeSelector:
        node: devopscorner-monitoring
      resources:
        requests:
          memory: "2Gi"
          cpu: "500m"
        limits:
          memory: "2Gi"
          cpu: "500m"
      roles:
        - "data"
    - component: coordinators
      replicas: 3
      diskSize: "30Gi"
      nodeSelector:
        node: devopscorner-monitoring
      resources:
        requests:
          memory: "2Gi"
          cpu: "500m"
        limits:
          memory: "2Gi"
          cpu: "500m"
      roles:
        - "ingest"
Apply manifest
kubectl create -f opensearch-cluster.yaml -n observability
Access Portforward
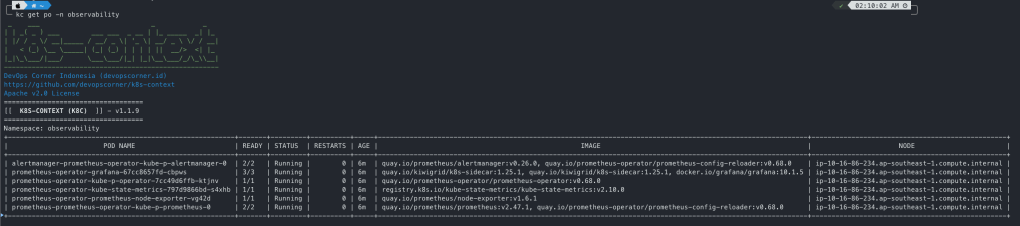
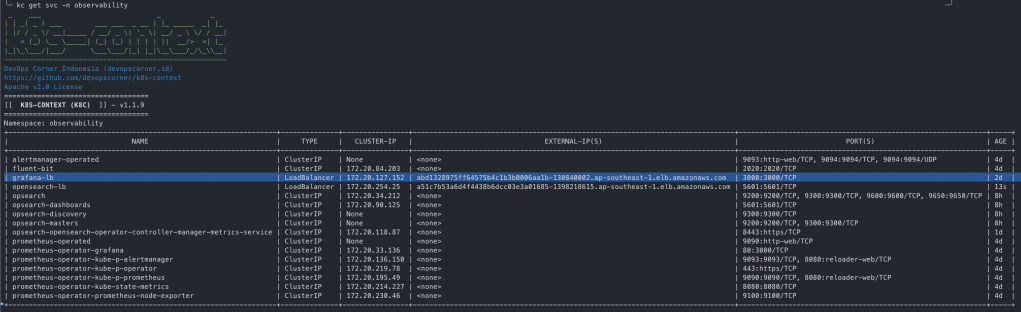
kubectl get po -n observability
NAME                                                            READY STATUS   RESTARTS  AGE
alertmanager-prometheus-kube-prometheus-alertmanager-0          2/2   Running  0         40m
opsearch-coordinators-0                                         1/1   Running  0         9m57s
opsearch-coordinators-1                                         1/1   Running  0         10m
opsearch-dashboards-7fcc5595c7-fhf28                            1/1   Running  0         22m
opsearch-masters-0                                              1/1   Running  0         10m
opsearch-masters-1                                              1/1   Running  0         13m
opsearch-nodes-0                                                1/1   Running  0         9m59s
opsearch-nodes-1                                                1/1   Running  0         13m
opsearch-opensearch-operator-controller-manager-7cc6dd6fd8qx5xd 2/2   Running  0         37m
kubectl get po opsearch-dashboards-7fcc5595c7-fhf28 -n observability
NAME                                 READY  STATUS   RESTARTS  AGE
opsearch-dashboards-7fcc5595c7-fhf28 1/1    Running  0         23m
kubectl get po opsearch-dashboards-7fcc5595c7-fhf28 -n observability
...
Containers:
  dashboards:
Container ID: containerd://02966406e8e5d2c9cef7c1e139b74887537386111374e29cf5c50ab3cbda19ae
Image: docker.io/opensearchproject/opensearch-dashboards:1.3.0
Image ID: docker.io/opensearchproject/opensearch-dashboards@sha256:7dcc706ab6c71ab00013e341246e7a701c11c61a7668e4dbecd298d6d7aef758
Port: 5601/TCP
Host Port:     0/TCP
...
kubectl port-forward opsearch-dashboards-7fcc5595c7-fhf28 5601:8080 -n observability
Forwarding from 127.0.0.1:5601 -> 8080
Forwarding from [::1]:5601 -> 8080

UserName: admin
Password: admin
Setup Pattern
Goto Stack Management
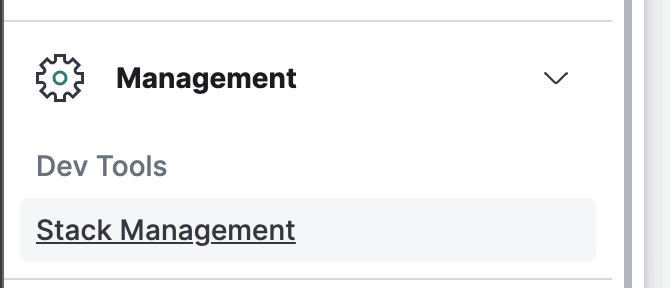
Create Index Pattern

Select Index Pattern

Setup Timestamp for sorting Index Pattern


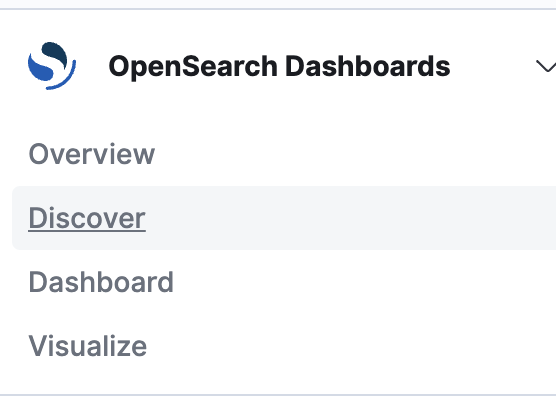
Discover Logs

Using Network LoadBalancer (NLB) via NGINX Controller
Get Deployment Manifest
wget https://raw.githubusercontent.com/kubernetes/ingress-nginx/main/deploy/static/provider/aws/deploy.yaml
Change Manifest
sed -i 's/externalTrafficPolicy: Local/externalTrafficPolicy: Cluster/g' deploy.yaml
Deploy Manifest
kubectl create -f deploy.yaml
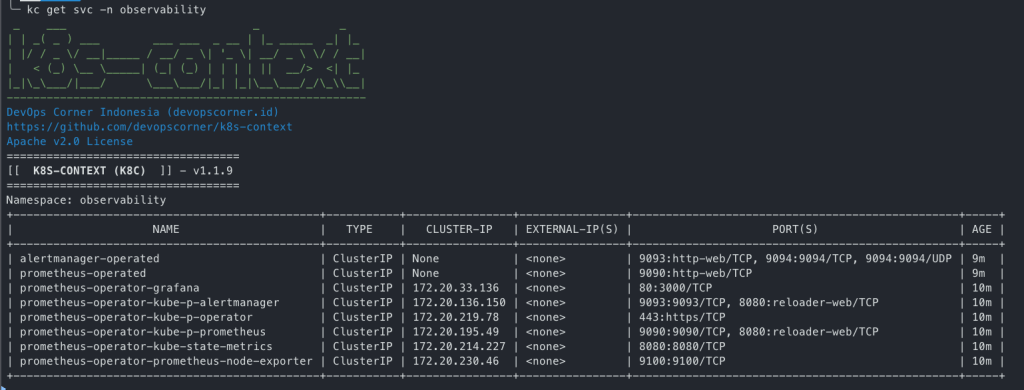
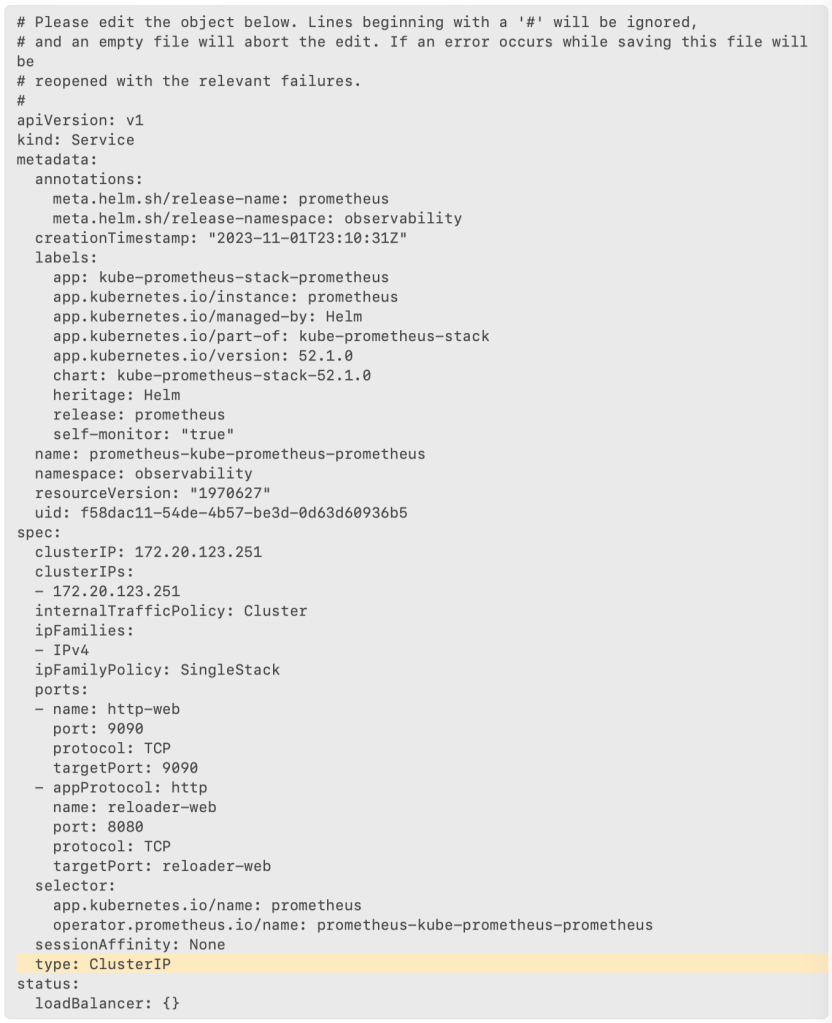
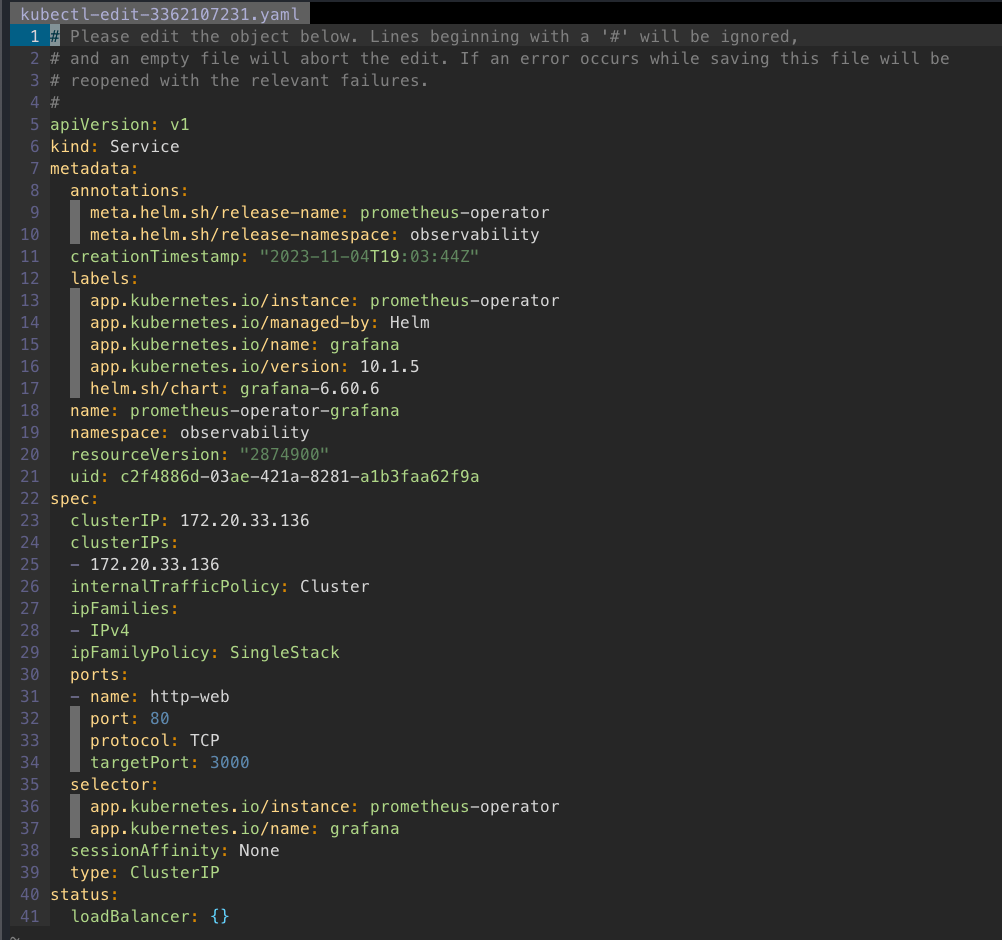
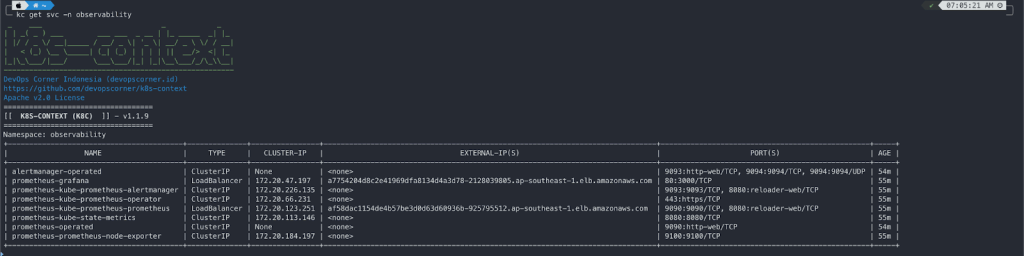
Expose LB for OpenSearch Dashboard
kubectl expose deployment opsearch-dashboards --name=opensearch-lb --type=LoadBalancer --port=80 --target-port=5601 --protocol=TCP --namespace=observability

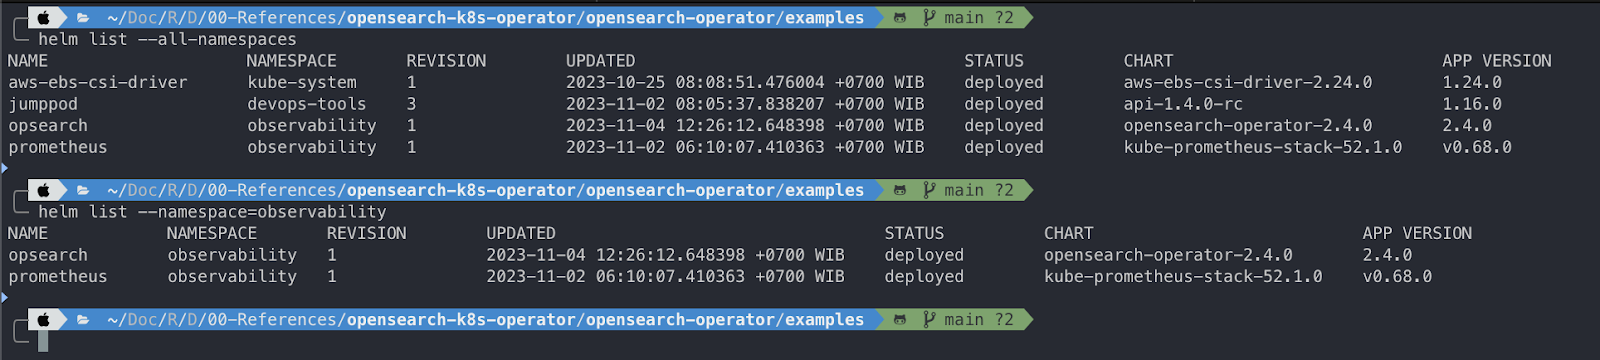
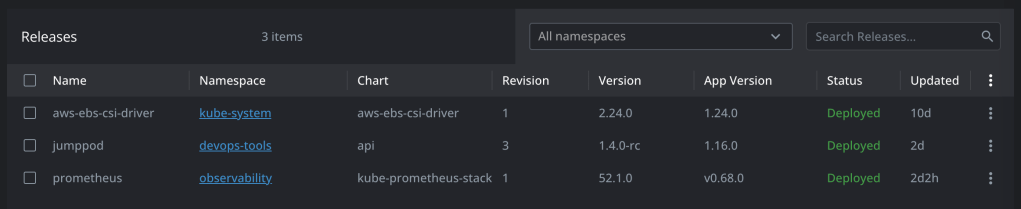
Helm Release Version
helm list --all-namespaces
helm list --namespace=observability


![[Webinar] Introduction to AWS Services](https://devopscorner.id/wp-content/uploads/2022/03/community-builders-social-1024px-alt.png?w=825&h=510&crop=1)


![[RFC] Rate Limits API Requests](https://devopscorner.id/wp-content/uploads/2022/02/devops-green-big-bg.jpg?w=825&h=510&crop=1)

You must be logged in to post a comment.