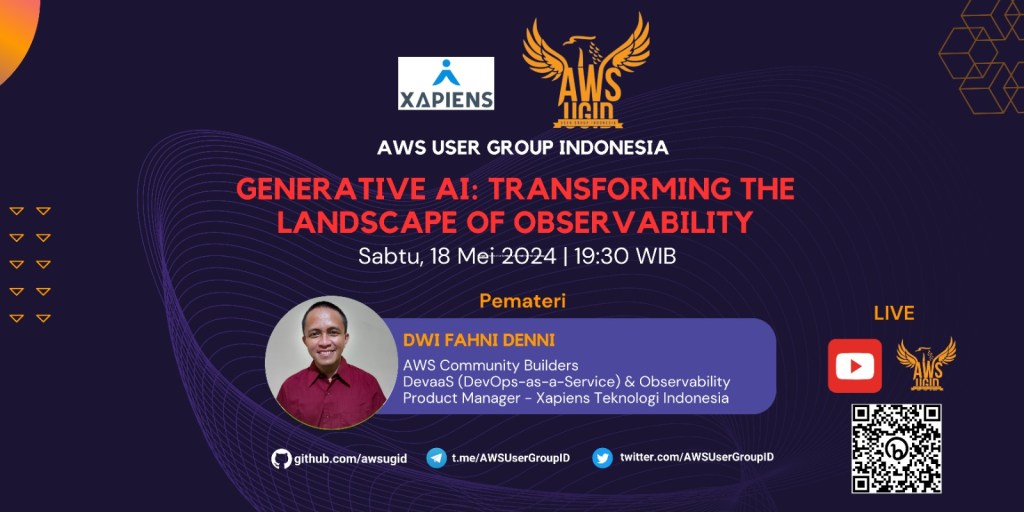
OpenSearch Operator

Step by step instructions: How to deploy OpenSearch Operator inside Kubernetes Cluster (EKS)

Prerequirements

Install Helm

brew install helm
brew install helmfile 
brew install kubectl

Add Plugin Helm  

helm plugin install https://github.com/databus23/helm-diff
helm plugin install https://github.com/hypnoglow/helm-s3.git

Add Helm Repository S3 Bucket

### LAB ###
helm s3 init s3://devopscorner-helm-chart/lab
AWS_REGION=ap-southeast-1 helm repo add devopscorner-lab s3://devopscorner-helm-chart/lab

### STAGING ###
helm s3 init s3://devopscorner-helm-chart/staging
AWS_REGION=ap-southeast-1 helm repo add devopscorner-staging s3://devopscorner-helm-chart/staging

### PRODUCTION ###
helm s3 init s3://devopscorner-helm-chart/prod
AWS_REGION=ap-southeast-1 helm repo add devopscorner s3://devopscorner-helm-chart/prod
helm repo update

Update Repository  

helm repo add stable https://charts.helm.sh/stable
helm repo add opensearch-operator https://opster.github.io/opensearch-k8s-operator/
helm repo update
helm repo list 

NAME                URL
opensearch-operator https://opster.github.io/opensearch-k8s-operator/
stable              https://charts.helm.sh/stable

Create Namespace

kubectl create namespace observability

Install OpenSearch Operator

helm install opsearch opensearch-operator/opensearch-operator --create-namespace -n observability

NAME: opsearch
LAST DEPLOYED: Sat Nov  4 09:08:25 2023
NAMESPACE: observability
STATUS: deployed
REVISION: 1
TEST SUITE: None

Install Cluster OpenSearch 

Change this default OpenSearch-Cluster.yaml

apiVersion: opensearch.opster.io/v1
kind: OpenSearchCluster
metadata:
  name: my-cluster
  namespace: default
spec:
  general:
    version: "1.3.0"
    httpPort: 9200
    vendor: opensearch
    serviceName: my-cluster
    monitoring:
      enable: true
    pluginsList: ["repository-s3"]
  dashboards:
    version: "1.3.0"
    enable: true
    replicas: 2
    resources:
      requests:
        memory: "1Gi"
        cpu: "500m"
      limits:
        memory: "1Gi"
        cpu: "500m"
  confMgmt:
    smartScaler: true
  nodePools:
    - component: masters
      replicas: 3
      diskSize: "30Gi"
      nodeSelector:
      resources:
        requests:
          memory: "2Gi"
          cpu: "500m"
        limits:
          memory: "2Gi"
          cpu: "500m"
      roles:
        - "master"
        - "data"
    - component: nodes
      replicas: 3
      diskSize: "30Gi"
      nodeSelector:
      resources:
        requests:
          memory: "2Gi"
          cpu: "500m"
        limits:
          memory: "2Gi"
          cpu: "500m"
      roles:
        - "data"
    - component: coordinators
      replicas: 3
      diskSize: "30Gi"
      nodeSelector:
      resources:
        requests:
          memory: "2Gi"
          cpu: "500m"
        limits:
          memory: "2Gi"
          cpu: "500m"
      roles:
        - "ingest"

LAB Configuration (Simple Cluster) 

apiVersion: opensearch.opster.io/v1
kind: OpenSearchCluster
metadata:
  name: opsearch
  namespace: observability
spec:
  general:
    version: "1.3.0"
    httpPort: 9200
    vendor: opensearch
    serviceName: opsearch
    monitoring:
      enable: true
    pluginsList: ["repository-s3"]
  dashboards:
    version: "1.3.0"
    enable: true
    replicas: 1
    nodeSelector:
      node: devopscorner-monitoring
    resources:
      requests:
        memory: "200Mi"
        cpu: "500m"
      limits:
        memory: "512Mi"
        cpu: "500m"
  confMgmt:
    smartScaler: true
  nodePools:
    - component: masters
      replicas: 2
      diskSize: "10Gi"
      nodeSelector:
        node: devopscorner-monitoring
      resources:
        requests:
          memory: "2Gi"
          cpu: "500m"
        limits:
          memory: "2Gi"
          cpu: "500m"
      roles:
        - "master"
        - "data"

LAB Configuration (HA Cluster) 

apiVersion: opensearch.opster.io/v1
kind: OpenSearchCluster
metadata:
  name: opsearch
  namespace: observability
spec:
  general:
    version: "1.3.0"
    httpPort: 9200
    vendor: opensearch
    serviceName: opsearch
    monitoring:
      enable: true
    pluginsList: ["repository-s3"]
  dashboards:
    version: "1.3.0"
    enable: true
    replicas: 1
    nodeSelector:
      node: devopscorner-monitoring
    resources:
      requests:
        memory: "200Mi"
        cpu: "500m"
      limits:
        memory: "512Mi"
        cpu: "500m"
  confMgmt:
    smartScaler: true
  nodePools:
    - component: masters
      replicas: 2
      diskSize: "30Gi"
      nodeSelector:
        node: devopscorner-monitoring
      resources:
        requests:
          memory: "2Gi"
          cpu: "500m"
        limits:
          memory: "2Gi"
          cpu: "500m"
      roles:
        - "master"
        - "data"
    - component: nodes
      replicas: 2
      diskSize: "30Gi"
      nodeSelector:
        node: devopscorner-monitoring
      resources:
        requests:
          memory: "2Gi"
          cpu: "500m"
        limits:
          memory: "2Gi"
          cpu: "500m"
      roles:
        - "data"
    - component: coordinators
      replicas: 2
      diskSize: "30Gi"
      nodeSelector:
        node: devopscorner-monitoring
      resources:
        requests:
          memory: "2Gi"
          cpu: "500m"
        limits:
          memory: "2Gi"
          cpu: "500m"
      roles:
        - "ingest"

Production Configuration (HA Cluster) 

apiVersion: opensearch.opster.io/v1
kind: OpenSearchCluster
metadata:
  name: opsearch
  namespace: observability
spec:
  general:
    version: "1.3.0"
    httpPort: 9200
    vendor: opensearch
    serviceName: opsearch
    monitoring:
      enable: true
    pluginsList: ["repository-s3"]
  dashboards:
    version: "1.3.0"
    enable: true
    replicas: 2
    nodeSelector:
      node: devopscorner-monitoring
    resources:
      requests:
        memory: "200Mi"
        cpu: "500m"
      limits:
        memory: "1Gi"
        cpu: "500m"
  confMgmt:
    smartScaler: true
  nodePools:
    - component: masters
      replicas: 3
      diskSize: "30Gi"
      nodeSelector:
        node: devopscorner-monitoring
      resources:
        requests:
          memory: "2Gi"
          cpu: "500m"
        limits:
          memory: "2Gi"
          cpu: "500m"
      roles:
        - "master"
        - "data"
    - component: nodes
      replicas: 3
      diskSize: "30Gi"
      nodeSelector:
        node: devopscorner-monitoring
      resources:
        requests:
          memory: "2Gi"
          cpu: "500m"
        limits:
          memory: "2Gi"
          cpu: "500m"
      roles:
        - "data"
    - component: coordinators
      replicas: 3
      diskSize: "30Gi"
      nodeSelector:
        node: devopscorner-monitoring
      resources:
        requests:
          memory: "2Gi"
          cpu: "500m"
        limits:
          memory: "2Gi"
          cpu: "500m"
      roles:
        - "ingest"

Apply manifest 

kubectl create -f opensearch-cluster.yaml -n observability

Access Portforward

kubectl get po -n observability 


NAME READY STATUS RESTARTS AGE
alertmanager-prometheus-kube-prometheus-alertmanager-0 2/2 Running 0 40m
opsearch-coordinators-0 1/1 Running 0 9m57s
opsearch-coordinators-1 1/1 Running 0 10m
opsearch-dashboards-7fcc5595c7-fhf28 1/1 Running 0 22m
opsearch-masters-0 1/1 Running 0 10m
opsearch-masters-1 1/1 Running 0 13m
opsearch-nodes-0 1/1 Running 0 9m59s
opsearch-nodes-1 1/1 Running 0 13m
opsearch-opensearch-operator-controller-manager-7cc6dd6fd8qx5xd 2/2 Running 0 37m

kubectl get po opsearch-dashboards-7fcc5595c7-fhf28 -n observability

NAME READY STATUS RESTARTS AGE
opsearch-dashboards-7fcc5595c7-fhf28 1/1 Running 0 23m

kubectl get po opsearch-dashboards-7fcc5595c7-fhf28 -n observability

...
Containers:
dashboards:

Container ID: containerd://02966406e8e5d2c9cef7c1e139b74887537386111374e29cf5c50ab3cbda19ae
Image: docker.io/opensearchproject/opensearch-dashboards:1.3.0
Image ID: docker.io/opensearchproject/opensearch-dashboards@sha256:7dcc706ab6c71ab00013e341246e7a701c11c61a7668e4dbecd298d6d7aef758
Port: 5601/TCP
Host Port: 0/TCP
...

kubectl port-forward opsearch-dashboards-7fcc5595c7-fhf28 5601:8080 -n observability

Forwarding from 127.0.0.1:5601 -> 8080
Forwarding from [::1]:5601 -> 8080

UserName: admin
Password: admin

Setup Pattern

Goto Stack Management

Create Index Pattern

Select Index Pattern

Setup Timestamp for sorting Index Pattern

Discover Logs

Using Network LoadBalancer (NLB) via NGINX Controller

Get Deployment Manifest

wget https://raw.githubusercontent.com/kubernetes/ingress-nginx/main/deploy/static/provider/aws/deploy.yaml

Change Manifest

sed  -i 's/externalTrafficPolicy: Local/externalTrafficPolicy: Cluster/g' deploy.yaml

Deploy Manifest

kubectl create -f deploy.yaml

Expose LB for OpenSearch Dashboard

kubectl expose deployment opsearch-dashboards --name=opensearch-lb --type=LoadBalancer --port=80 --target-port=5601 --protocol=TCP --namespace=observability

Helm Release Version

helm list --all-namespaces
helm list --namespace=observability

Prometheus Operator

Step by step instructions: How to deploy Prometheus Operator inside Kubernetes Cluster (EKS)

Prerequirements

Install Helm

brew install helm
brew install helmfile 
brew install kubectl

Add Plugin Helm  

helm plugin install https://github.com/databus23/helm-diff
helm plugin install https://github.com/hypnoglow/helm-s3.git

Add Helm Repository S3 Bucket

### LAB ###
helm s3 init s3://devopscorner-helm-chart/lab
AWS_REGION=ap-southeast-1 helm repo add devopscorner-lab s3://devopscorner-helm-chart/lab

### STAGING ###
helm s3 init s3://devopscorner-helm-chart/staging
AWS_REGION=ap-southeast-1 helm repo add devopscorner-staging s3://devopscorner-helm-chart/staging

### PRODUCTION ###
helm s3 init s3://devopscorner-helm-chart/prod
AWS_REGION=ap-southeast-1 helm repo add devopscorner s3://devopscorner-helm-chart/prod
helm repo update

Update Repository  

helm repo add stable https://charts.helm.sh/stable
helm repo add grafana https://grafana.github.io/helm-charts
helm repo add prometheus-community https://prometheus-community.github.io/helm-charts
helm repo update
helm repo list 

NAME                URL
prometheus-community https://prometheus-community.github.io/helm-charts
grafana             https://grafana.github.io/helm-charts
stable              https://charts.helm.sh/stable

Create Namespace

kubectl create namespace observability

Install Prometheus Operator

helm install prometheus-operator prometheus-community/kube-prometheus-stack --create-namespace -n observability

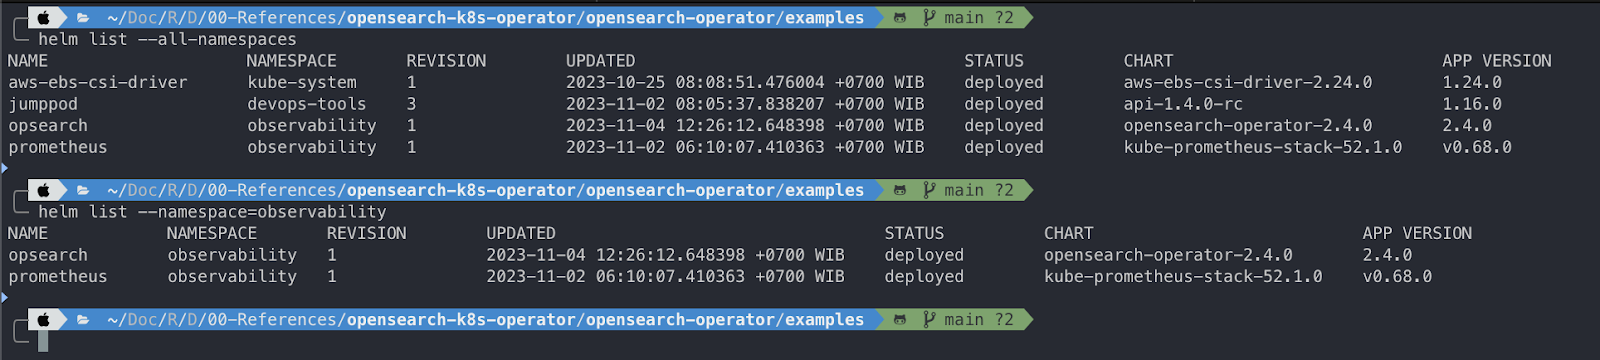
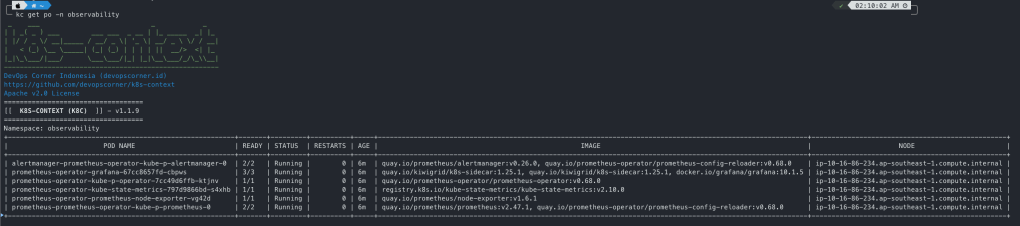
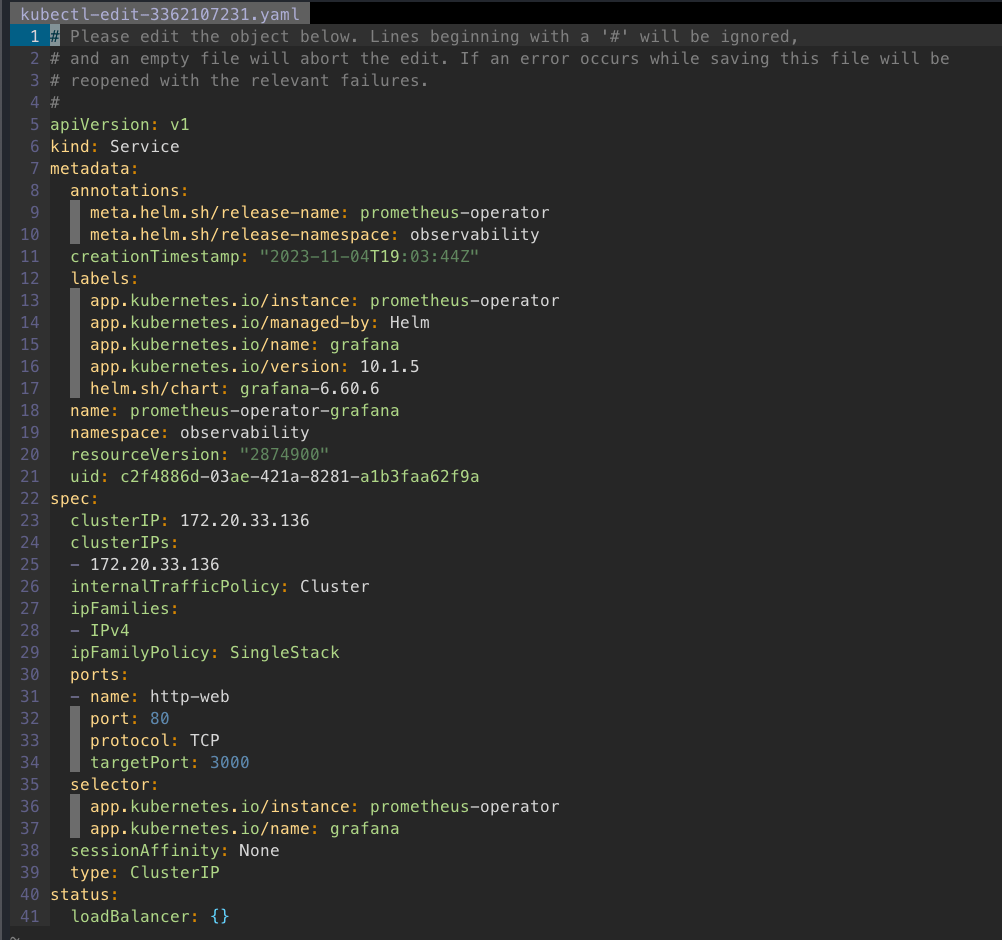
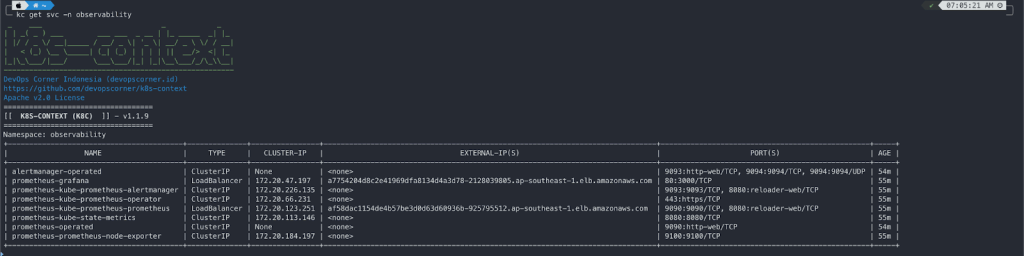
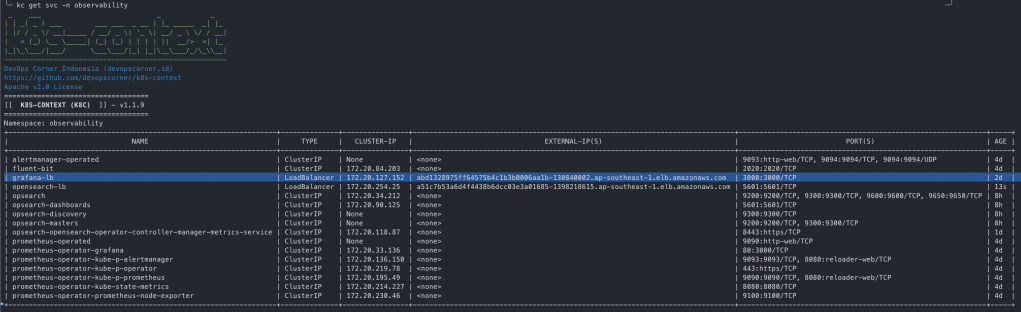
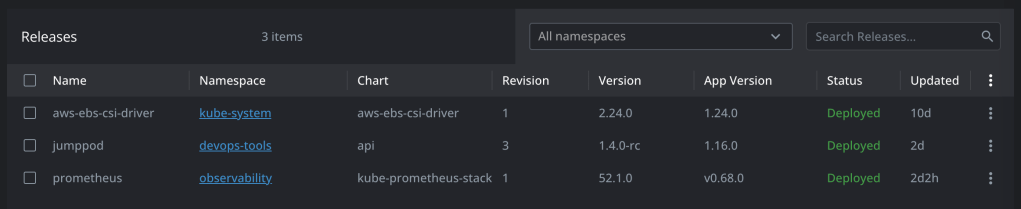
NAME: prometheus-operator
LAST DEPLOYED: Sun Nov  5 02:03:06 2023
NAMESPACE: observability
STATUS: deployed
REVISION: 1
NOTES:
kube-prometheus-stack has been installed. Check its status by running:
kubectl --namespace observability get pods -l "release=prometheus-operator"

kubectl get po -n observability

NAME                                                     READY   STATUS    RESTARTS   AGE
alertmanager-prometheus-kube-prometheus-alertmanager-0   2/2     Running   0          32m
prometheus-grafana-55fb596bf5-5257r                      3/3     Running   0          32m
prometheus-kube-prometheus-operator-757f8788d4-v6tk5     1/1     Running   0          32m
prometheus-kube-state-metrics-898dd9b88-98qlj            1/1     Running   0          32m
prometheus-prometheus-kube-prometheus-prometheus-0       2/2     Running   0          32m
prometheus-prometheus-node-exporter-llfn2                1/1     Running   0          32m
prometheus-prometheus-node-exporter-nrpkq                1/1     Running   0          32m

kubectl --namespace observability get pods -l "release=prometheus-operator"

NAME                                                      READY   STATUS    RESTARTS   AGE
prometheus-operator-kube-p-operator-7cc49d6ffb-ktjnv      1/1     Running   0          2m16s
prometheus-operator-kube-state-metrics-797d9866bd-s4xhb   1/1     Running   0          2m16s
prometheus-operator-prometheus-node-exporter-vg42d        1/1     Running   0          2m16s

kc get po -n observability

kubectl get svc -n observability

NAME                                           TYPE        CLUSTER-IP       EXTERNAL-IP   PORT(S)                      AGE
alertmanager-operated                          ClusterIP   None             <none>        9093/TCP,9094/TCP,9094/UDP   11m
prometheus-operated                            ClusterIP   None             <none>        9090/TCP                     11m
prometheus-operator-grafana                    ClusterIP   172.20.33.136    <none>        80/TCP                       11m
prometheus-operator-kube-p-alertmanager        ClusterIP   172.20.136.150   <none>        9093/TCP,8080/TCP            11m
prometheus-operator-kube-p-operator            ClusterIP   172.20.219.78    <none>        443/TCP                      11m
prometheus-operator-kube-p-prometheus          ClusterIP   172.20.195.49    <none>        9090/TCP,8080/TCP            11m
prometheus-operator-kube-state-metrics         ClusterIP   172.20.214.227   <none>        8080/TCP                     11m
prometheus-operator-prometheus-node-exporter   ClusterIP   172.20.230.46    <none>        9100/TCP                     11m

kc get svc -n observability 

Edit Prometheus Service 

Change to type LoadBalancer from ClusterIP

kubectl edit svc prometheus-kube-prometheus-prometheus -n observability

Edit Grafana Service 

Change to type LoadBalancer from ClusterIP

kubectl edit svc prometheus-grafana -n observability

Access Load Balancer

Grafana Access

http://a7754204d8c2e41969dfa8134d4a3d78-2128039805.ap-southeast-1.elb.amazonaws.com

UserName: admin
Password: prom-operator

Change Credentials Grafana

kubectl get secret -n  observability

NAME                                                                TYPE                 DATA   AGE
alertmanager-prometheus-operator-kube-p-alertmanager                Opaque               1      40h
alertmanager-prometheus-operator-kube-p-alertmanager-generated      Opaque               1      40h
alertmanager-prometheus-operator-kube-p-alertmanager-tls-assets-0   Opaque               0      40h
alertmanager-prometheus-operator-kube-p-alertmanager-web-config     Opaque               1      40h
prometheus-kube-prometheus-admission                                Opaque               3      4d12h
prometheus-operator-grafana                                         Opaque               3      40h
prometheus-operator-kube-p-admission                                Opaque               3      40h
prometheus-operator-kube-p-prometheus                               Opaque               0      40h
prometheus-prometheus-operator-kube-p-prometheus                    Opaque               1      40h
prometheus-prometheus-operator-kube-p-prometheus-tls-assets-0       Opaque               1      40h
prometheus-prometheus-operator-kube-p-prometheus-web-config         Opaque               1      40h

Change Base64 Credentials

  • Change User Encode (admin-user)

echo “devopscorner-admin” | base64
4oCcZGV2b3BzY29ybmVyLWFkbWlu4oCdCg==

  • Change Password Encode (admin-password)

echo “devopscorner-secret” | base64
4oCcZGV2b3BzY29ybmVyLXNlY3JldOKAnQo=

  • Edit admin-password and admin-user from encoded base64 string

kubectl edit secret prometheus-operator-grafana -n observability

Prometheus Access

http://af58dac1154de4b57be3d0d63d60936b-925795512.ap-southeast-1.elb.amazonaws.com:9090

Using Jumpods

References:
https://github.com/devopscorner/devopscorner-helm/tree/master/helmfile/jumppod

Test with Curl (Inside Jumpods)

curl prometheus-kube-prometheus-prometheus.observability.svc.cluster.local:9090

curl prometheus-grafana.observability.svc.cluster.local

Using Network LoadBalancer (NLB) via NGINX Controller

Get Deployment Manifest

wget https://raw.githubusercontent.com/kubernetes/ingress-nginx/main/deploy/static/provider/aws/deploy.yaml

Change Manifest

sed  -i 's/externalTrafficPolicy: Local/externalTrafficPolicy: Cluster/g' deploy.yaml

Deploy Manifest

kubectl create -f deploy.yaml

Expose LB for Grafana Dashboard

kubectl expose deployment prometheus-operator-grafana --name=grafana-lb --type=LoadBalancer --port=80 --target-port=3000 --protocol=TCP --namespace=observability

Helm Release Version

helm list --all-namespaces
helm list --namespace=observability

AWS Summit ASEAN 2023

Get Ready for new excited event from AWS Summit 2023 ASEAN.
Register:
https://go.aws/45uCdyi

Implementing Observability using AWS Distro for OpenTelemetry (ADOT) will present:

– Introduction Observability and Monitoring
– Introduction OpenTelemetry and ADOT (AWS Distro for Open Telemetry)
– Demo sample with Golang RESTful API

In conclusion, by implementing AWS Distro for OpenTelemetry (ADOT), you have taken a crucial step towards ensuring the performance, reliability, and security of your RESTful API application.

With it’s powerful features and seamless integration with OpenTelemetry, ADOT provides real-time visibility into your API, helping you to quickly identify and resolve performance issues and keep your API running smoothly.

All material presentation will also publish in series at my personal blogs: https://devopscorner.id, stay tune and keep in touch!

#aws #awscloud #awssummit #awssummitasean #awscommunity #awscommunitybuilders #devops #xapiens #devopscorner

[Webinar] Docker: from Zero to Deploy

Event Invitation: bit.ly/AWSNgalamBackend-02
Recorded: https://www.youtube.com/watch?v=8lkRRnuDEhU

Docker adalah sistem operasi untuk kontainer. Mirip dengan cara mesin virtual memvirtualisasi (menghilangkan kebutuhan untuk secara langsung mengelola) perangkat keras server, kontainer memvirtualisasi sistem operasi server. Docker memberikan perintah sederhana yang dapat Anda gunakan untuk membuat, memulai, atau menghentikan kontainer.

Penasaran gak sih gimana caranya menggunakan Docker untuk aplikas kamu?

Tenang aja sesi kali ini Dwi Fahni Denni, AWS Community Builder – Infrastructure & Cloud Services Manager Xapiens dan Muhammad Syukur Abadi, Student & Developer at Ngalam Backend bakal ngenalin docker dari awal banget nih.

Catat tanggalnya 📌

Tanggal: Rabu, 21 Desember 2022

Waktu: 19.00 WIB

Tempat: Online

Presentation Slide
https://devopscornerid.files.wordpress.com/2022/12/awsug-docker-from-zero-to-deploy.pdf

Source Code
https://github.com/devopscorner/demo

MindMap Modern Application with AWS Cloud

I share my MindMap channel topics “Modern Application using AWS Cloud” :

1. AWS Cloud Computing
https://www.mindmeister.com/2436655468/modern-apps-01-aws-cloud-computing

2. AWS Security Compliance
https://www.mindmeister.com/2436655503/modern-apps-02-aws-security-compliance

3. AWS Disaster Recovery
https://www.mindmeister.com/2436655521/modern-apps-03-aws-disaster-recovery

4. AWS Serverless
https://www.mindmeister.com/2436655677/modern-apps-04-aws-serverless

5. AWS Container
https://www.mindmeister.com/2436655558/modern-apps-05-aws-container

Hope you’ll find useful information…

Thanks !

#aws #awscloud #awscommunitybuilders #mindmap #modernapps #devopscorner

[Webinar] Introduction to AWS Services

Event Invitation: bit.ly/AWSProbolinggoDev-01
Recorded: https://www.youtube.com/watch?v=GOCPQSzFrfw

Webinar: Introduction to AWS Services

Amazon Web Services (AWS) merupakan penyedia layanan cloud yang aman dan telah digunakan secara luas di dunia termasuk startup.

AWS menawarkan lebih dari 200 layanan unggulan yang lengkap dari pusat data secara global. Penasaran ga sih gimana cara menerapkan AWS ini pada perusahaan kalian, dan apa keuntungan yang didapatkan jika suatu perusahaan menggunakan layanan AWS ini?

Temukan jawabannya dengan mengikuti sesi kali ini dengan tema “Introduction to AWS Services” bersama Dwi Fani Denni, AWS Community Builder / Infrastructure & Cloud Services Manager at Xapiens

Mark your calendar!

Hari/Tanggal: Jum’at, 9 September 2022
Waktu: 19.00 WIB

Jangan lupa daftarkan diri kalian pada link di bawah ini ya! bit.ly/AWSProbolinggoDev-01

Picture-01: AWS Cloud Computing
Picture-02: On-Premises – IaaS – PaaS – SaaS
Picture-03: AWS Security & Compliance
Picture-04: Share Responsibility Model Between AWS & Customer for Security & Compliance
Picture-05: AWS Disaster Recovery
Picture-04: Share Responsibility Model Between AWS & Customer for Disaster Recovery
Picture-05: AWS Serverless
Picture-06: AWS Container

Infrastructure Kubernetes (EKS) Cost Monitoring & Optimization

As an integral part of the DevOps culture, Cost Monitoring & Optimization is the most important element in monitoring and optimizing the use of infrastructure, especially in today’s cloud computing era. In this event, we will discuss the strategy of cost monitoring & optimization of infrastructure in using Kubernetes (EKS) on AWS.

In this session, we will discuss provisioning estimation costs, autoscaling systems, downscale schedules, and alerting systems for cost usage notifications from cost limitation budgets.

Don’t miss ZX Talk – Infrastructure Kubernetes (EKS) Cost Monitoring & Optimization which will be held on:

Date: Thursday, 23 June 2022
Time: 14.00 – 15.30 (2 – 3.30 pm) Jakarta
Place: Virtual Meet

ZXTalk: Infrastructure Kubernetes (EKS) Cost Monitoring & Optimization

Registration Links:
https://bit.ly/3Qy7Ejx

#ZebraX #DigitalTransformation #MonitoringTools #Kubernetes #CostMonitoring #Optimization #Industry40 #ZXTalk #AWSCommunityBuilders #DevOpsCorner

AWS Summit ASEAN 2022

Just to remind you for new excited event from AWS; AWS Summit ASEAN (Online), will be held on May 18th 2022.

Join me and my fellow community speakers and register at:
https://lnkd.in/gEE-fn_y

I will presenting the topic: Using IaC with Terraform to provision Big Data Platform on Amazon EMR.

#AWSSummit #awssummit2022 #aws #awscloud #bigdata #infrastructureascode #zebrax #devopscorner

GitOps with AWS Developer Tools

Hi There,

In this article, I’d like to share about GitOps (Git Operations) and AWS Developer Tools to provide GitOps workflow.

I will separate our discussion with 3 section articles. This article will focus on GitOps and AWS Developer Tools, later on for 2 section articles in the future will discuss about The IaC (Infrastructure-as-Code) Tools using Terraform and The Implementation of IaC tools for provisioning infrastructure and it’s integration with AWS Developer Tools.

So, let’s go…

As Introduction, I will let you know about:

  1. Introduction of GitOps
  2. GitOps Pipeline
  3. GitOps Workflows in DevSecOps

Introduction of GitOps

The introduction of GitOps (Git Operations) is starting from the term, if we take a look for the terms it self, there was a huge number of definition around the internet. In my opinion, the “GitOps” (Git Operations) is a way to do collaboration -as a team-, provide the operations of DevOps in releasing application, including version control, ci/cd and provisioning in modern cloud infrastructure.

Why we need GitOps?

Nowadays, thousands of delivering application took place in mobile platform. There was also numerous complexity of the application running background in web application. This application whether it’s running Web only or even in Mobile, had been built in more than a single programming language and more than a single layer of infrastructure architecture.

The more complex from the application, it will take more complex also in development & deployment process. In the GitOps workflow, collaboration team to work in sequence process is a part of DevOps culture, starting from versioning control of the source code, pull request (PR), pairing view code, approval process, delivering source code until testing in deployment environment.

This collaboration team also needed as a pair team to reproduce the steps or even to mitigate the errors that will come in the future.

GitOps Pipeline

Diagram-1: GitOps Flow (enlarge for detail)

When we look at the ideal process of delivering a service from source code to provisioning the environment, there are a number of stages and processes involved.

In this Diagram-1 for example, you can see how the GitOps pipeline works in a deployment container application. The developers carry out development inside an isolated environment using AWS Cloud9 as an IDE, and they use AWS Developer tools to run build, test and deploy the services in the GitOps flow.

At the beginning, source codes will be pushed into AWS CodeCommit to make a PR (Pull Requests) step, this will also trigger AWS CodeBuild services to run inspection code for the code quality & code security check. If the PR is approved, it will run the pipeline to build the container image that will be registered inside Amazon ECR as a container registry.

The building image will be identified with tagging or commit hash that will also be pulled by AWS CodeBuild as references and delivered to the staging environment. Meanwhile for the production environment, approval will be needed before deployment process.

GitOps Workflows in DevSecOps

If we integrate the security pipeline (as shown in Diagram-2), it will have 2 additional stages – SAST & DAST. The Static Application Security Testing (SAST) including Security Configuration Assessment (SCA) will run before the deployment of the staging environment. The Dynamic Application Security Testing (DAST) will inspect and test the staging environment deployment before it is moved to the production environment.

Diagram-2: GitOps Workflow in DevSecOps (enlarge for detail)

This DAST will use a standard application that comes from OWASP (The Open Web Application Security Project).

How to Choose The Best Pipeline?

Again, my answer is depend, in how complexity your application layer and what kind of infrastructure do you plan to deploy.

In my opinion, if you need to deploy a static application that doesn’t need a complex database and integration, i will choose in the first diagram. But if the application layer will took place some of integration, such as 3rd party authorization, caching the assets (javascript, css, etc), session token, etc i will choose the second diagram as an ideal approach.

So, I hope this article bring you the knowledge about The GitOps and their workflow. We will see you again in other article for implementation GitOps flow with IaC Tools.

See you,

DFDenni

#aws #awscloud #awscommunitybuilders #awsdevelopertools #devopscorner